Benefits decision makers rely on data to understand how employees use their health plan and identify areas where spending could be more efficient. The good news: There is plenty of data. The better news: You can trust Blue Cross and Blue Shield of Minnesota to transform that information into actionable insights that help employees live their healthiest lives and employers achieve a total cost of care 7% lower than national competitors.1
A wealth of data provides visibility into cost savings and employee wellness, but it can also be overwhelming to analyze when there are multiple information sources and measurement strategies. Blue Cross helps transform numbers into next steps, combining past data and predictive analytics to understand how to bend the cost curve. These insights are program-specific; for example, case management information shows that data-driven interventions with rising risk populations reduce hospital admissions by up to 13%.2
These advanced capabilities in identifying savings opportunities provide employers with the transparency and tools needed to save on healthcare costs while meeting employee needs.
Past data uncovers affordability wins and challenges
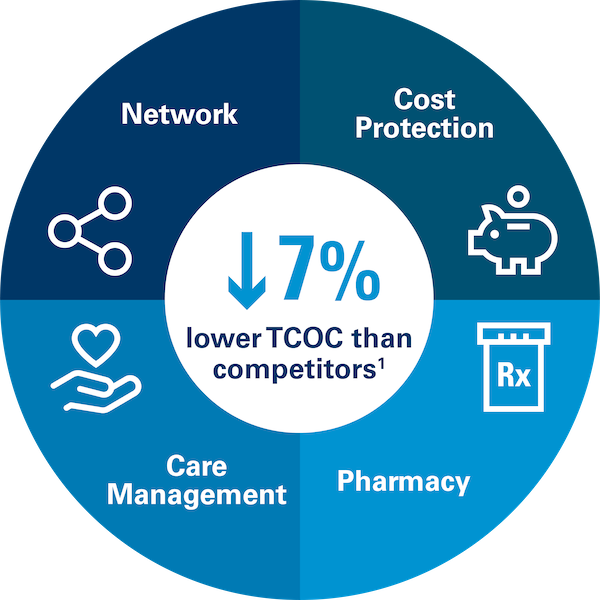
Customers value Blue Cross plans for unmatched network access, industry-leading care management, transparent cost protection, and integrated pharmacy benefits. Data shows that through these programs, Blue Cross achieves a total cost of care that is 7% lower than national competitors.1
Analyzing historical data helps us understand how each program area provides cost savings to employers. Internal and external benchmarks support recommendations for customized, flexible benefit options and enhancements to increase savings. In addition, deep analysis of past usage and cost data unlock insights to strengthen our industry-leading programs and power Blue Cross innovation.
Predictive analytics support reduction in medical costs
Past data is a valuable tool to make sense of potential cost drivers, but that’s not the only area where we drive insights. Predictive analytics powers our human-centered case management programs to realize up to a 19% trend reduction in medical costs.3
The Blue Cross case management model applies predictive analytics to determine employee risk levels, categorizing members into three areas: low, rising and high risk. This approach ensures a comprehensive view of care history, social drivers of health, gaps in care and likeliness to engage in programs. Once a risk level is identified, our Case Managers apply their clinical expertise to the forward-looking analytics to develop a coordinated care plan aimed at achieving positive health outcomes and reducing cost.
Blue Cross case management by risk level
- Low risk: Focus on prevention. Encourage next best actions through Blue Care Advisor and integrated health and wellbeing programs.
- Rising risk: Concentrate on efforts to prevent movement into high risk, such as readmission prevention. Through timely interventions and appropriate referrals, we reduce hospital readmissions by up to 13%.2
- High risk: Create personalized care plans to meet holistic needs. Implement programs such as complex care management and high-risk maternity care.
Predictive analytics enables proactive and individualized interventions to promote a healthier, more active, more supported population.
Artificial intelligence (AI) supports Blue Cross data and analytics
AI is a powerful tool that equips Blue Cross to tackle the increasing amount of available healthcare data in a responsible, meaningful and scalable way. Leveraging AI to connect the dots between past data and predictive modeling helps us understand your employees better so we can help them live their healthiest lives.
When it comes to approving care, we never allow a machine to make a denial. We use rule-based AI algorithms to help arrive at a faster “yes.” In fact, 60% of requests are approved in five minutes or less.
By harnessing the power of AI, Blue Cross effectively manages past, present and even future information to help employers make decisions that improve health outcomes while increasing affordability.
Innovation with people at the center
Employers expect continuous innovation from their healthcare benefits, and Blue Cross data and analytics rise to that challenge. To further analyze trend data at the client level, we’re piloting a new data visualization tool that provides a deeper view into cost drivers and potential interventions.
As the most trusted health plan for 15 years in a row,4 Blue Cross manages data responsibly and transparently to provide actionable insights to benefits teams.
For more information on how data and analytics at Blue Cross can uncover savings opportunities for you, read our articles on artificial intelligence and case management or contact your Blue Cross representative.
SVG
Subscribe to Insights & Updates
Keep tabs on what's new and what's changing in the healthcare industry.
SVG
Let's work together
Give us a call: 1-877-293-7035 (TTY 711)
Not already working with Blue Cross? Check out our plans and resources for large and small groups.
1 Singleton A, Tilley C, Rachlin S. “Milliman Analysis of Total Cost of Care Benchmarks,” March 2025.
2 Blue Cross and Blue Shield of Minnesota internal member data, updated November 2024. In commercial engaged members compared to unengaged members.
3 Blue Cross and Blue Shield of Minnesota internal data, 2024.
4 “Is a name you can trust.” (phone interviews conducted 2010 – 2013) and “Is a company I can trust.” (online interviews conducted 2014 – 2025), Brand Strength Measure Survey, Blue Cross and Blue Shield Association.